Early childhood vaccination has been a topic of heated public discussion for years. The standard early childhood schedule was designed to give children a strong foundation of immunity by age 2 and has been in use by practitioners and recommended by the CDC for decades. Despite this, immunization rates in children under 2 have been dropping steadily year over year. One can track the specifics of this downward trend using the data annually supplied to HRSA by Federally Qualified Health Centers (FQHCs) and their lookalike counterparts. In a previous blog post, my colleague Adam Douglas did just that, using Azara DRVS data to break down how immunization rates have changed between 2021 and 2023.
Azara DRVS independently tracks each immunization included in HRSA’s Childhood Immunization Status eCQM CMS117 measure. A closer look at this data quickly reveals not all vaccines are created equal; children are far less likely to get some vaccines than others. The 2-dose influenza vaccine, for example, has a far lower average completion rate (35%) than the other vaccines in the measure (>= 60%). Because of its low completion rate, the analysis below sets aside the flu vaccine to assess vaccination trends across the other measure components. (Why and how children are so much less likely to get the flu vaccine merits its own separate analysis, and won’t be addressed here.)
The CMS117 measure looks at 9 vaccine components in addition to flu. To meet the measure, by their second birthday, a child must receive:
- 4 diphtheria, tetanus, and acellular pertussis vaccines (DTaP),
- 3 polio vaccines (IPV),
- 1 measles, mumps, and rubella vaccine (MMR),
- 3 or 4 H influenza type B vaccines (HiB),
- 3 hepatitis B vaccines (Hep B),
- 1 chicken pox vaccine (VZV),
- 4 pneumococcal conjugate vaccines (PCV),
- 1 hepatitis A vaccine (Hep A),
- and 2 or 3 rotavirus vaccines (ROT)
If one dose of the 24 needed across these nine immunizations is missed, the child doesn’t meet the measure. In 2024, that meant half of all children 2-3 years old didn’t meet the measure, even when the 2-dose flu vaccine is taken out of consideration.
Lost follow-ups during a vaccine course could explain some of the downward trend we’re seeing year over year, since missing one dose is enough to miss the measure. However, a closer examination of the data reveals this isn’t fully the case.
Figure 1: Childhood Immunization Status
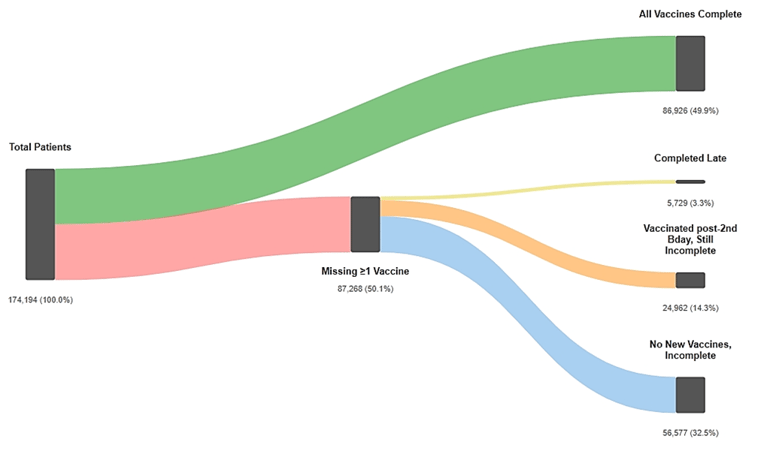
The above chart breaks down the patients who missed the measure into a few relevant subcategories. The first subcategory (in yellow) is patients who weren’t fully vaccinated by their second birthday, but ultimately completed the full course of vaccines. The second category (in orange) represents patients who received some additional vaccines after turning 2 but are still missing others. The remaining patients (in blue) missed the measure and haven’t gotten any vaccines after 2.
What this tells us is that for roughly 40% of patients, it’s not a simple case of missing a follow-up. They’re getting some or all their vaccines, just not in time to meet the measure’s deadline; a case of “better-late-than-never” rather than a binary missed-or-not.
Even so, ultimately getting all necessary vaccines is easier said than done, depending on which components of the measure a patient is missing when they turn 2. As the pie chart below illustrates, most children who miss the measure are only missing some vaccines. Represented by the lighter yellow slice, 12% of those children make up some missing vaccines off schedule, while another 3% (represented by light green) fully catch up on every vaccine they miss.
Figure 2: Childhood Vaccine Completion Status
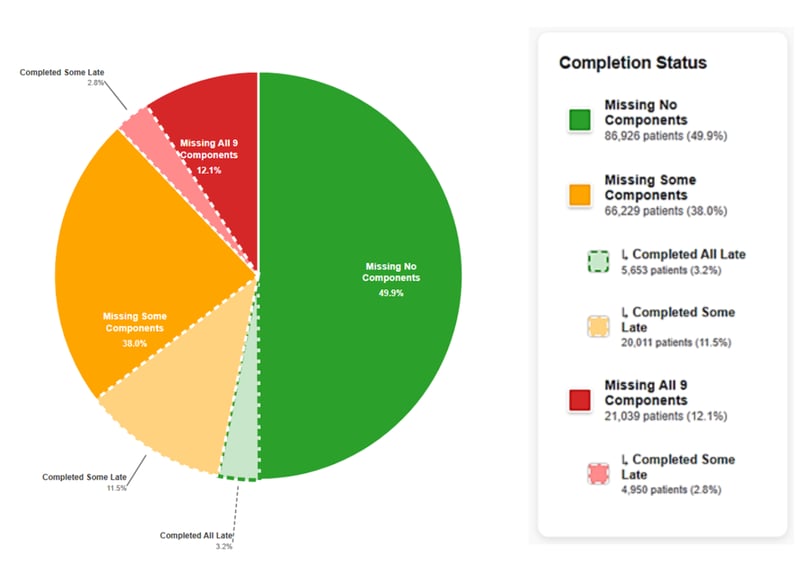
In contrast, for the 12% of kids who are missing all 9 vaccines at age 2, it’s not merely unlikely, but impossible to catch up. The same is true for some of the kids missing only a few vaccines. To explain why, we need to delve into the DRVS data that tracks each vaccine independently.
The graph below uses the 2024 DRVS data for the CMS117 measure. As you click ‘Next’ it will move through a breakdown of completion rates for the different measure components.
Figure 3: Immunization by Vaccine Breakdown
What's going on here?
In this view of the 2024 data, a group of four problematic vaccines emerges: rotavirus, PCV, DTaP and HiB, all of which have completion rates between ~60-70%. With the other five components all at or above 80% completion across the 2024 measure population, the trend suggests something in common between those four vaccines.
Starting off, let’s examine the recommended doses for these vaccines. PCV, DTaP, HiB and Rotavirus all require multiple doses: PCV and DTaP are 4-dose courses, while HiB and ROT require 2-4 doses depending on the vaccine’s formula. However, Hep B and IPV are also 3-dose courses and show completion rates over 80%, suggesting that number of doses alone doesn’t explain why these four vaccines are problematic.
Looking at the recommended dosage schedule helps make the pattern clearer. Table 1 (below) shows the earliest age (in months) when the final dose of each vaccine can be given. The table is based on the recommended Child and Adolescent Immunization Schedule from the CDC.
Table 1: Earliest Final Dose Can Be Given vs. Doses Needed
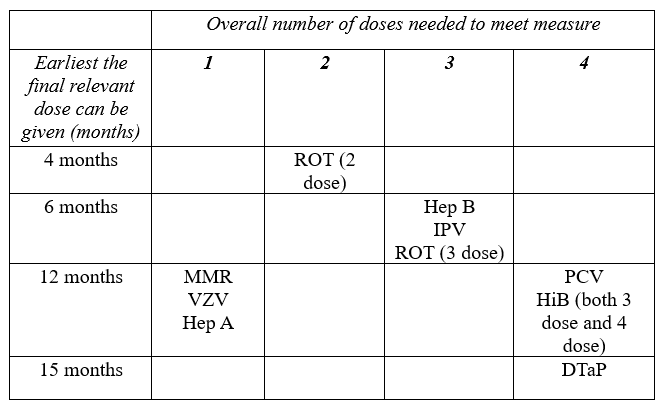
As the table shows, the last dose of PCV and either course of HiB isn’t clinically recommended until a child is 12 months or older. For DTaP, it’s even later, at 15 months minimum. A child is thus either getting five vaccines at their 1-year checkup, (their first and last dose of MMR, VZV and Hep A, plus final doses of PCV and HiB,) or providers and parents are prioritizing some shots over others. This requires bringing children back in for the outstanding vaccines, which isn’t always possible or feasible for a few reasons.
In DTaP’s case, there is no annual or other routine check-up coinciding with the end of its recommended schedule, meaning a child would need to be seen specifically to get their fourth dose. All of this is assuming that the child in question received the first 2-3 doses of PCV, HiB, and DTaP on schedule, and doesn’t need to wait longer to accommodate the recommended 4-6 months between doses.
Given the number of doses across vaccines that are squeezed into a child’s first 2 years of life and the recommended schedule for those doses, it’s unsurprising that PCV, HiB, and DTaP all have lower completion rates. The proportion of patients who ultimately complete these vaccines support that it’s mainly an issue of timing rather than willingness. In DTaP’s case, 10.7% of all patients are eventually completing the vaccine, just after the measure time frame of 2 years [Figure 3]. Those rates drop to 3.5% and 1.8% overall for PCV and HiB respectively, still suggesting that for some the question is not whether to get vaccinated, but when.
At first glance, rotavirus (ROT) appears to break this pattern. It’s the only vaccine where despite 12% of patients being seen after turning 2, none have completed the recommended ROT course. Reviewing the CDC’s recommended immunization schedule sheds light on why: the maximum age at which a child can receive their final dose of a ROT vaccine is 8 months (Source). If a child misses the deadline for that last dose of ROT, they both miss the measure and can’t fully catch up after age 2.
The strict schedule for ROT contextualizes not only why merely 3% of patients were able to complete the full course of vaccines after missing the measure, but also how some patients are missing the measure in the first place. When removing ROT as a requirement, 56.8% of kids who turned 2 in 2024 meet the measure. That’s 7% more than the 50% who meet the measure when ROT is required.
It’s unsurprising, then, that in 2025 only eight states required children to have completed a course of the ROT vaccine before starting school (Source). All eight of those states only require children to get the ROT vaccine when age-appropriate, or in other words, before they’re 8 months old. Not only does the current measure fail to capture the restrictive timing of the ROT vaccine, it’s also more rigorous than school entry vaccination requirements in practically every state.
The best indicator of whether a population is close to being fully vaccinated might thus be meeting the other 8 requirements in the CMS117 measure, outside of both ROT and flu. In the case of ROT, a parent would need to schedule appointments for their child to get 2 or 3 doses of the vaccine by 8 months and have nothing go wrong. If a child is sick, their parent has transportation, childcare, or other complications, or if their provider cancels, they can miss the measure completely through no fault of their own. Thus, the same timing issue that drives patients missing PCV, DTaP, and HiB vaccinations restricts ROT vaccinations even further.
This begs the question: if the current time frame for the CMS117 measure is so restrictive, why keep to 2 years at all? HRSA takes their cue when designing the measure from the CDC Advisory Committee on Immunization Practices’s (ACIP) clinical recommendations. ACIP’s recommended schedule is structured to catch children when vaccines are most clinically effective, ensuring they have robust, long-term immune protection before they’re sent off to daycare or kindergarten (Source).
So, 2 years of age it is. But what Azara DRVS data has shown is that meeting the measure’s requirements is more complex than it looks. Children who aren’t included in the measure may still get fully vaccinated, just after their second birthday. Among those children who don’t catch up, it’s not as binary as vaccine hesitancy or a lost follow-up.
Looking deeper into ROT, PCV, DTaP, and HiB shows that the tight schedule for kids to receive up to 24 doses of 9 different vaccines (26 across 10 if you factor in flu,) means some children miss the measure despite parents’ best efforts. More investigation is needed to assess how much of the population misses vaccines due to a timing or access issue versus vaccine hesitancy, but the children going back for additional shots off schedule suggest it’s a mix of the two.
Azara clients can leverage data already available in DRVS to keep an eye on these individual vaccines. By getting more granular than the overall CMS117v13 measure, clients can start to get a better understanding of when and how the children they serve may be falling behind.
In the meantime, Azara has tools outside of DRVS that can help centers identify and engage patients who are in danger of falling behind or missing vaccines entirely. Azara Patient Outreach (APO) has campaigns within its Core Clinical Module that target patients due for immunizations, stratified by appointment status. In addition, as this analysis has shown, DRVS data can be leveraged to zoom in on specific population characteristics that may be driving low vaccination rates in certain areas. A more in-depth study of how rural versus urban centers compare on this measure could offer additional insight and strategies for Azara clients to help their youngest patients lead long, healthy lives from their first appointment.
Ultimately, Azara’s DRVS data shows that falling short of the CMS117 measure is not always a reflection of vaccine refusal or disengagement, but often a consequence of tightly constrained schedules, missed timing windows, and real-world access barriers. A child who misses the measure at age two may still go on to receive most or all recommended vaccines shortly thereafter.
By looking beyond the aggregate score and examining individual vaccine completion patterns, health centers can better distinguish between delayed care and true gaps in immunization. This more nuanced view enables targeted outreach, smarter prioritization, and more effective use of DRVS tools—helping providers support timely vaccination while more accurately understanding the populations they serve.
Related Articles

From Delays to Action: How Real-Time Data Transforms Transitions of Care
Explore Insights
From Reporting to Results: 15 Years of Population Health Progress
Explore Insights