Uniform Data System (UDS) measures are clinical quality metrics collected by the Health Resources and Services Administration (HRSA) to assess health center performance in specific areas of public health. These measures are used to measure practices’ clinical quality performance, provide benchmarking with other health centers, and are required for mandatory grant funding reporting.
The Azara DRVS reporting and analytics platform has many robust reports and dashboards for users to track and visualize the various data elements that are included in UDS measures. One of the most powerful DRVS tools that care teams can utilize for day-to-day operations and quality improvement is the Patient Visit Planning (PVP) report.
Utilizing the Patient Visit Planning Report
The PVP provides current, actionable data listed by provider and patient in the order of each day’s scheduled appointments. Providers and other care team members huddle in the morning to review the PVP prior to a patient’s arrival for their appointments and use this time to identify, plan and prioritize patients who are due for immunizations, preventative services such as cancer screenings or A1c tests, and those with special needs.
The PVP also helps identify patient risk factors, such as smoking, obesity, mental health, and social challenges that might influence care and treatment decisions. The PVP is an important tool to assist in closing care gaps at the point of care and to improve adherence to care guidelines.
Figure 1: Example Patient Visit Planning Report for a Demo Patient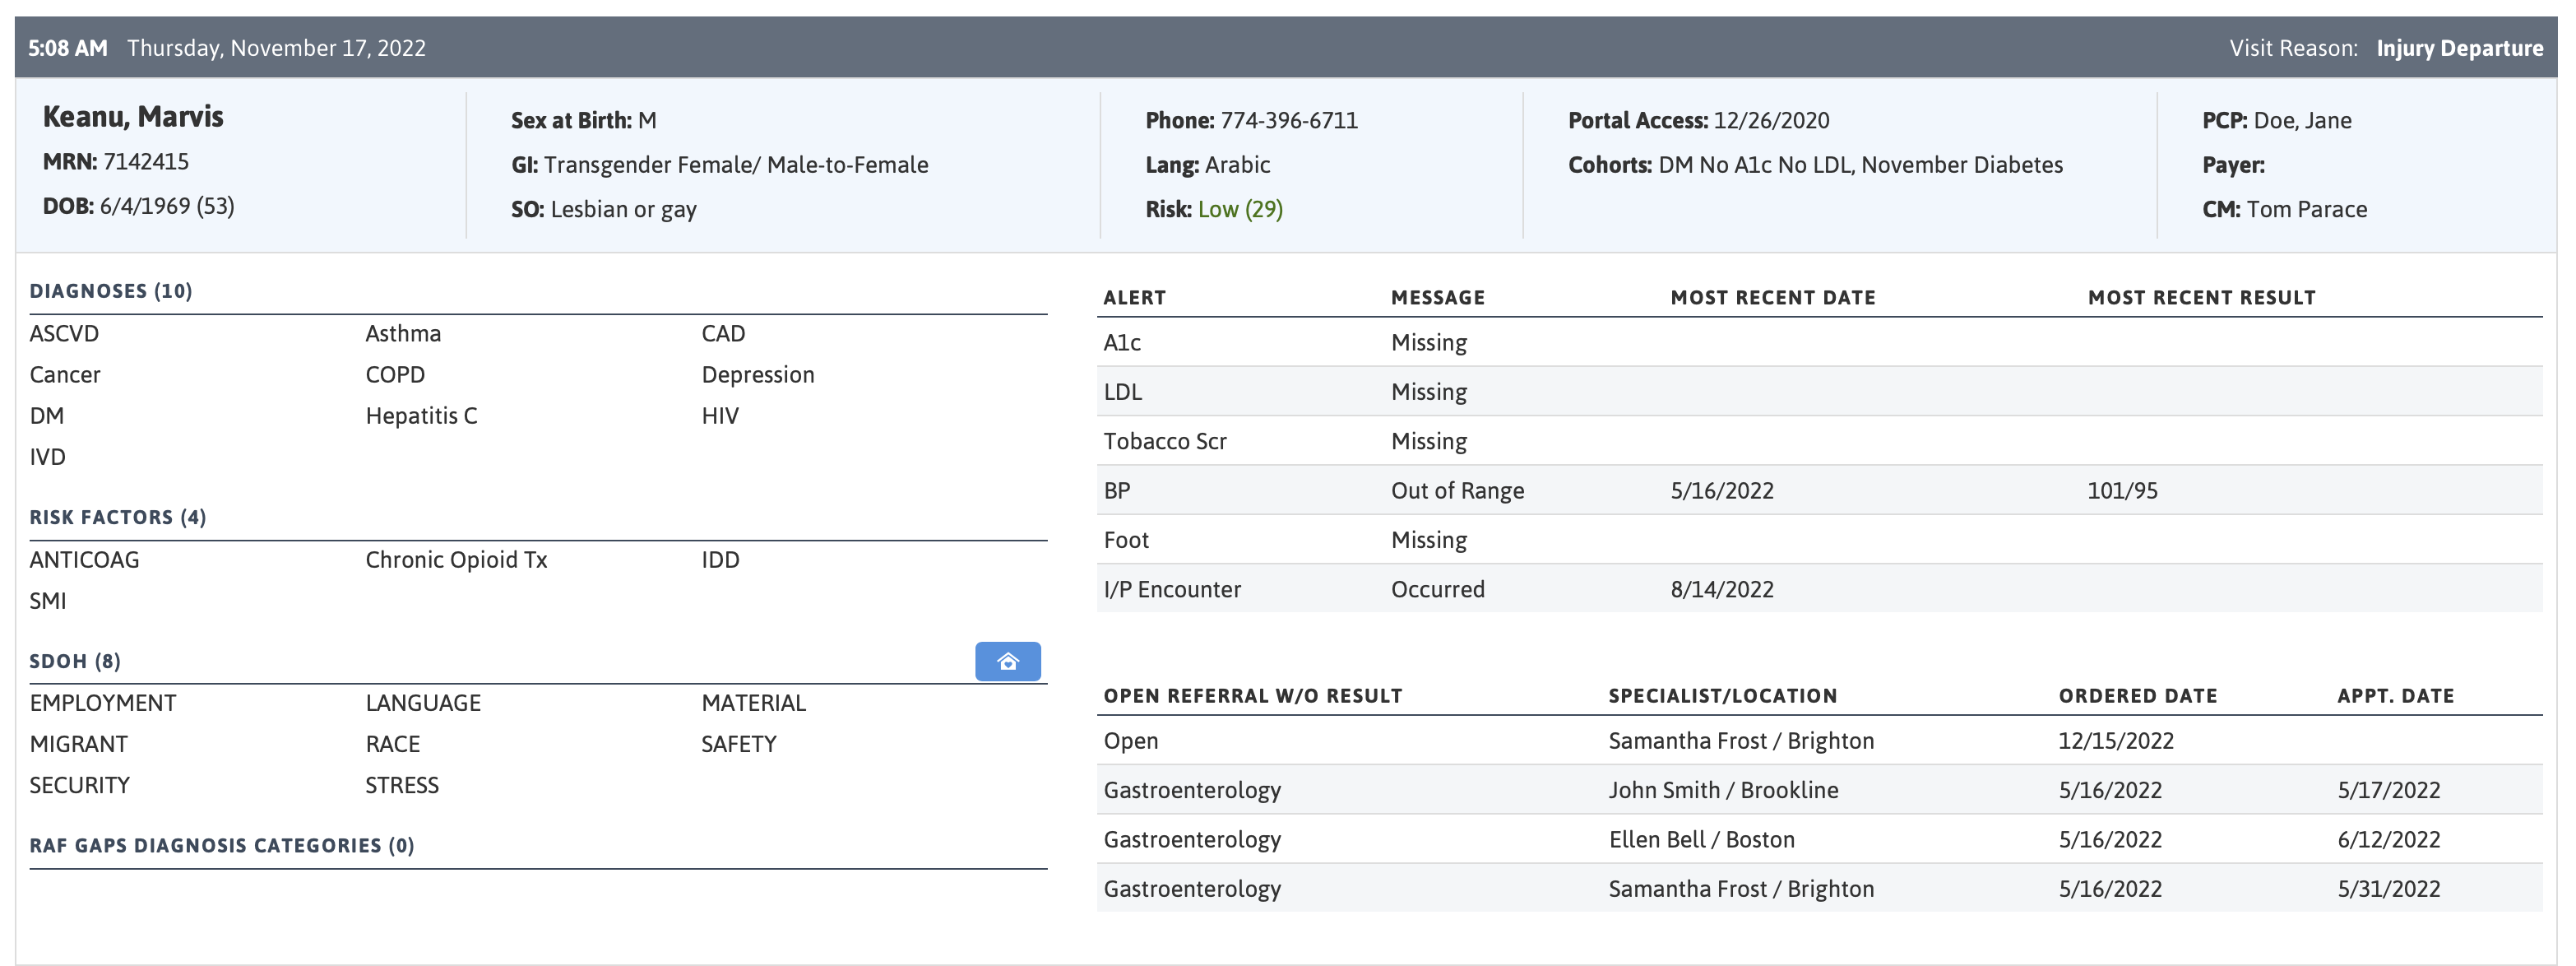
Measuring the Difference
Although we at Azara feel that the Patient Visit Planning report is a great tool for helping improve UDS outcomes (admittedly, we may be a bit biased), we wanted to see if there was a measurable difference between the UDS results of health centers who use the PVP on a regular basis compared to centers that do not.
To do so, we utilized the official UDS outcomes data for measurement year 2020 as published on the HRSA website. First, state-specific mean values were calculated for each of five specific UDS measures, taking into account both Azara and non-Azara centers. Many “benchmarks” (state means, national means, regional means) could be used in this analysis, but we felt that the state mean was the best way to measure an FQHC against a reasonable size sample set of their peers.
Next, Azara client health centers were divided into two distinct groups: those that utilized the PVP an average of five times a week or more in the measurement year, and those that did not. Finally, we looked at how the scores from those two groups compared to the state-specific means.
The chart below illustrates the results of this comparison. The vertical y-axis represents the difference from the state mean in percentage points, while the horizontal x-axis is divided into the five specific measures. Within each measure group, there are results for the two groupings of Azara centers: purple represents Azara centers with an average PVP use of five times a week or more, and the pink color is those Azara centers who are not regular users of the PVP.
The estimated difference is displayed for each of the groups within each measure with a dot, while the bars surrounding the dot show a 95% confidence interval of this estimated difference.
Figure 2: Comparison of Measure Performance when using the PVP
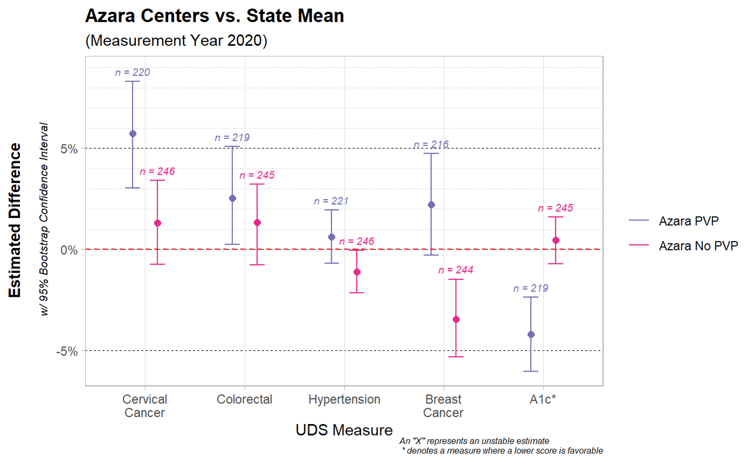
Most of these UDS measures show a significant difference between the two groups. Looking at the Cervical Cancer Screening measure, for example, there is an estimated 5% difference between centers that regularly use PVP and the state average. Meanwhile, the centers that do not utilize the PVP as frequently see less of an improvement over the state mean. Note that for the A1c measure, a lower score is better.
The Azara Effect
You may look at this graphic and conclude that using Azara DRVS, and specifically utilizing the PVP at least daily, leads to better UDS measure performance outcomes. Although this is certainly a possibility, it is not realistic to assume that use of the PVP data accounts for this one distinguishing characteristic between groups. The data is observational in nature and not from a properly controlled study where other variable can be accounted for. But, if we depart from academic certainty, it is worth exploring measure by measure what effect the PVP could have had and analyzing why the chart above looks like it does.
Impacting patient outcomes is always more challenging than impacting a process. For example, the Hypertension measure is what we refer to as an ‘outcomes measure’, which measures the actual health outcomes for a patient. These measures are more difficult to impact, as they involve appropriate treatment, follow-up, and patient engagement in their care for exercise, diet, medications, etc. The A1c measure is also an ‘outcomes measure’, and we see significant improvement in that measure, unlike the Hypertension measure.
While we would like to believe that by using DRVS and the PVP, Azara contributed to improved A1c control, it is more likely that the impact is due to more A1c testing being completed— allowing actual readings to be available to assess control (remember, in this measure, if a recent reading is not available, the patient is considered out of control). In contrast, the Hypertension control measure would not be as affected by this, since blood pressure readings are a routine part of a visit, we don’t have as much of a problem with “missingness” in blood pressure readings.
The other three measures involve cancer screenings, and are considered ‘process measures’ (i.e., are the correct processes occurring to care for the patient). The hypothesized effect of PVP use on these measures is roughly equivalent to the health centers’ ability to close the care gap without outside involvement.
Generally, most health centers can perform cervical cancer screenings in house, and with adequate time (which the PVP allows the team to plan for) they can complete the PAP/HPV test during the visit. For colorectal cancer, the PVP serves as a reminder to start the conversation about screening options and provide the patient with a FOBT/FIT or Cologuard screening kit which the patient can take home and perform. The open orders measure in DRVS then assists the practice with follow-up reminders and tracking of tests not yet returned.
Conversely, very few health centers have in-house mammography capabilities, and the patient is usually responsible for scheduling a mammogram on their own with an outside provider. The challenges of getting that appointment scheduled, completed, and closing the referral loop are significant, and therefore we tend to see a lower success rate in that measure.
Despite these caveats, our analysis does show a difference in measure outcomes and hints at what we like to call “The Azara Effect”. What is that effect exactly? In this context, that effect seems to be having the right information and tools to provide the right care at the right time to the right patients—which is the very thing the PVP was designed to do. Combining a quick summary of the patient and their care gaps together with systematic workflows can ease the burden of care teams as they work to provide the best care to their patients.
Related Articles

From Release to Recovery: Closing Care Gaps for Justice-Involved Populations
Explore Insights
Turning Every Encounter into Value: How Azara's EHR Plug-In Elevates Risk Adjustment at the Point of Care
Explore Insights