Introduction
Social Drivers of Health (SDOH) are the conditions in which people are born, grow, live, work, and age, and they can include factors like income, education, housing, access to healthcare, employment, social support, and food security. Addressing SDOH is becoming increasingly important in healthcare policy, research, and public health, reflecting a broader shift in how health is understood, managed, and improved.
It's commonly understood that social factors can contribute to a wide range of health disparities and inequities. But to what extent? We wanted to use data to explore the potential impact of SDOH on a patient's health. To be specific, we chose diabetes, since its status can be reasonably estimated by a single number, A1c levels, which lends itself to this analysis.
Design
To get a large enough sample size, we looked at the Hemoglobin A1c Level Distribution measure across two states. We ran the measure for 2024 while filtering to patients with diabetes diagnoses and at least one A1c lab to get the patients for the analysis and their most recent A1c. The measure conveniently categorizes A1c results into 5 levels (0% to 6.99%, 7% to 7.99%, 8% to 8.99%, = 9%, and >9%) for easy interpretation. Lastly, we applied the SDOH filter to explore any potential relationships between various SDOH triggers and A1c.
Analysis
We started off by checking the total number of SDOH triggers a patient has against their A1c result. An SDOH trigger refers to a specific indicator or event that signals a person may be experiencing a social need that affects their health — such as food insecurity, housing instability, lack of transportation, or financial hardship. Intuitively, the more SDOH triggers a patient has, the more likely they may be negatively impacting a patient's health. Let's see if that's true in diabetes management.
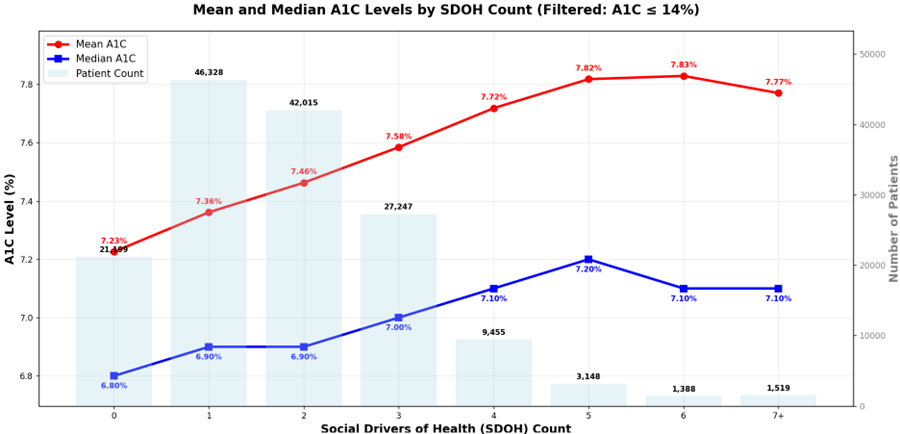
The visual above looks at the mean and median A1c values as SDOH count increases for our sample size of over 150k patients. To read this chart effectively, follow the left y-axis (A1c values) to see how the mean and median A1c levels change across different SDOH counts on the x-axis. The dual-axis design allows you to also see the patient count (right y-axis) for each SDOH group, providing context for the sample sizes. When interpreting the data, pay attention to both the absolute A1c values and the relative differences between mean and median lines, as this indicates the distribution skewness within each SDOH group. Overall, we find A1c values increase as SDOH tally increases. There appears to be an interesting peak around SDOH count 5, suggesting a possible critical threshold where social drivers begin to have maximum cumulative impact. Beyond this point, additional social drivers may not proportionally worsen A1C control.
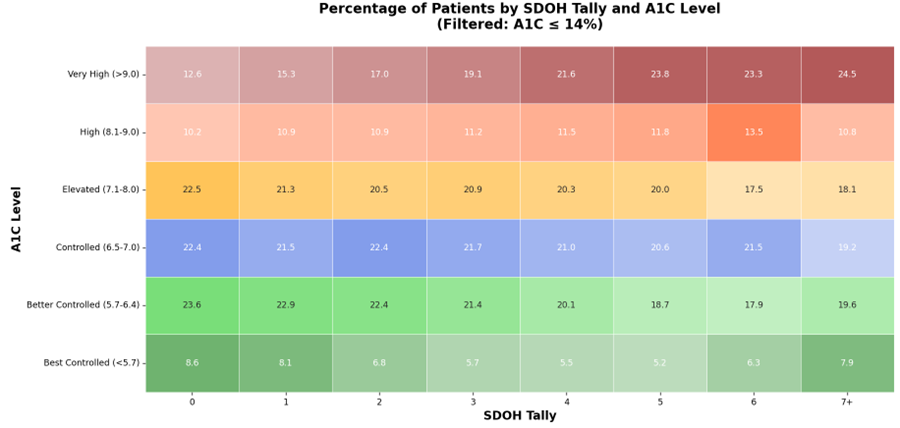
Taking it a step further, we grouped A1c values into levels. The visualization below shows a distinct heatmap of the percentage of patients by SDOH tally for each A1c level category. As SDOH count increases from 0 to 6, we observe a general pattern where the proportion of patients with well-controlled A1c levels (Best Controlled and Better Controlled categories) tends to decrease, while the proportion of patients with elevated A1c levels (High and Very High categories) tends to increase.
The Very High A1C (>9.0%) group shows the most dramatic increase (nearly doubles) between SDOH count 0-5, then plateaus slightly, while the Best Controlled A1c (<5.7%) group shows the steepest decline between SDOH count 0-5 (8.6% → 5.2%), with slight recovery at SDOH count 7+, coinciding with the peak we observed in the mean/median analysis. This visual clearly demonstrates that social drivers of health have a substantial impact on diabetes management, with the most pronounced effects seen in the extreme A1c categories.
Is the impact statistically significant? Using a chi-square test, we confirmed the statistically significant association between SDOH triggers and A1c control (p < 0.05).
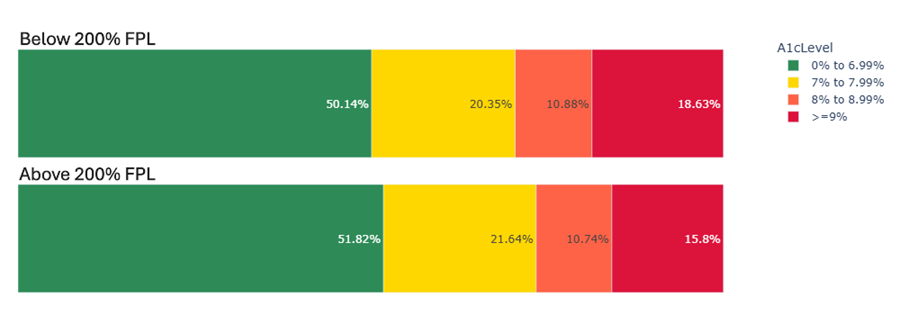
Since SDOH covers a wide range of social factors, we expect different SDOH triggers have different levels of impact on patient health. We picked poverty to check for potential relationships between poverty and A1c control. The visual below shows the percentage of patients in different A1c levels between patients with and without the SDOH FPL<200% (incomes below 200 percent of the federal poverty level) trigger. There appears to be a significant difference in the proportion of patients with A1c >= 9% between patients with and without the FPL<200% trigger, (18.6% vs. 15.8%). It may be because those with lower income might not be able to afford medications, regular doctor visits, or healthy food, which can make it difficult to keep blood sugar levels in check.
Some possible further explorations could be:
- Continued Individual SDOH Trigger Analysis: Beyond poverty, how do other specific SDOH triggers impact diabetes control? We could examine triggers like food insecurity, housing instability, transportation barriers, or lack of health insurance individually to understand which social factors have the strongest correlation with poor A1c control. This could help prioritize interventions and resource allocation.
- Combining with Claims Data: The ACU Dashboard in DRVS can be utilized to explore the relationship between SDOH triggers and cost. ACU supports grouping measures like Cost PMPM, Avoidable ED Visits, Avoidable IP Visits, and more by SDOH. Do some social factors lead to higher healthcare costs compared to other social needs? Is the cost difference significant? This could help identify the SDOH trigger that’s most impactful in cutting costs.
- Geographic and Demographic Variations: Can the same trends be observed in other populations or across different demographic groups? Analyzing data from multiple states or comparing urban vs. rural populations, different age groups, or racial/ethnic communities could reveal important variations in how SDOH affects diabetes management across different contexts.
- Controllable vs. Uncontrollable SDOH Factors: Is there a different level of impact between controllable SDOH triggers (temporary or improvable social factors like transportation access or food assistance) and uncontrollable SDOH triggers (social factors that cannot be easily or immediately changed like historical discrimination or geographic location)? If so, is the difference statistically significant? This analysis could inform intervention strategies.
- Longitudinal Analysis: How do SDOH triggers affect diabetes control over time? A longitudinal study could track patients' A1c levels as their SDOH status changes, providing insights into whether addressing social needs leads to improved diabetes outcomes.
- Intervention Effectiveness: What types of interventions are most effective at mitigating the impact of SDOH on diabetes control? This could involve analyzing outcomes for patients who receive social support services, case management, or other SDOH-focused interventions.
- Sample Size and Statistical Power: Given the limitations we observed with high SDOH counts, design a new study with larger sample sizes of patients with high SDOH burdens, test the hypothesis that patients with 7 or more SDOH triggers do not experience significantly worse diabetes control compared to those with moderate SDOH burdens (3-6 triggers). This would allow us to make reliable conclusions about the relationship between extreme SDOH burdens and diabetes outcomes.
Conclusion
In these brief examples, we saw that social factors significantly impact diabetes management outcomes, with clear evidence that higher SDOH burdens correlate with poorer A1c control up to a certain threshold. We observed that mean and median A1c values increase as SDOH count rises from 0 to 5, and that the proportion of patients with well-controlled diabetes decreases while those with elevated A1c levels increases over the same range. We identified vulnerable populations of patients with SDOH 7+ who have 2x higher risk of very high A1c compared to those with no SDOH factors. Furthermore, we found that poverty specifically shows a measurable impact, with patients below 200% of the federal poverty level having a higher rate of very high A1c levels (18.6% vs. 15.8%.)
By leveraging DRVS to stratify patients based on both clinical indicators—such as elevated A1c—and documented SDOH triggers, care teams can more effectively identify high-risk patients and deploy targeted interventions. DRVS also enables longitudinal tracking of outcomes, helping organizations evaluate the impact of addressing SDOH triggers on diabetes care and management.
Related Articles

From Release to Recovery: Closing Care Gaps for Justice-Involved Populations
Explore Insights
Turning Every Encounter into Value: How Azara's EHR Plug-In Elevates Risk Adjustment at the Point of Care
Explore Insights