In recent weeks the Biden administration announced it is trying to make better sense of COVID hospitalization numbers. The issue, which is not new, is that medical records and reporting make it very hard to distinguish between patients who come to the hospital because of a severe case of COVID, those who come because COVID has exacerbated another condition like heart disease, and those who come for a condition unrelated to COVID and happen to test positive while there.
This problem stems partly from structural characteristics of the US healthcare system: complex, independent EHRs, disjointed data collection, and ever-more burdensome documentation requirements of physicians and care teams. This data is clearly valuable; hospitalization numbers are an important tool in developing guidance and setting policies and will likely become a more important metric than case counts as the pandemic continues. While we may all agree that having this information is crucial, we must also acknowledge the limitations and challenges associated with obtaining and interpreting it.
Naturally as I read the article referenced above, I started thinking about Azara’s database and how our customers sometimes struggle to make sense of their own numbers. DRVS contains millions of patient records, displayed in so many ways that it can be hard to know where to look for the right report. Even if you do find it, the data is complex, so how do you make sense of what you see?
I always like to start by defining the question I am trying to answer. Are you looking for the number of patients who have had a COVID booster, or the number of boosters you have administered? Do you want to know how many positive COVID cases there were among your patient population in the last week? Last month? The more specific you can get with your question, the easier it will be to tell if the report you are using is the right one.
Let’s look an example of COVID reporting in DRVS to help illustrate this process:
If I want to know how many of my practice’s patients have been vaccinated, where do I go? First, we must define some parameters around this question.
- What does “my practice’s patients” mean? In DRVS, this typically means patients who have had a qualifying encounter in the period. What counts as a qualifying encounter is defined during your initial implementation and can be viewed in Mapping Administration, but as a general rule refers to visits where a patient saw a provider who can exercise independent clinical judgement. If we are only interested in those patients, we need to find a measure or report that only counts patients who had that type of encounter in the period in which I am interested. We can also tell from this question that we are counting patients, not vaccinations.
- What do I mean by “have been vaccinated"? Is that one shot? Two shots? A booster? What about immunocompromised patients? Do I care if patients refused? Defining this question will depend on who wants this data and what they consider “being vaccinated” – this could be leadership at the practice, state agencies, or the federal government. Right now, HRSA is asking for numbers of patients who initiated and completed the series, as well as those who received an additional shot and those who received a booster. But there are lots of other interested parties, including state and local governments, and they all likely have slightly different ideas of how to report on this information.
- In what time period am I interested? Do I want to see patients who have ever been to the practice or maybe only those in the past year? Almost all vaccinated persons initiated their series in 2021, so it probably only makes sense to look from January 1, 2021 onward, unless you are a hospital or had very early access to the vaccine.
Now that we have defined our parameters, where might you go in DRVS to find this information? I would start with the COVID-19 (SARS-COV-2) Immunization Status Active Patients scorecard shown below:
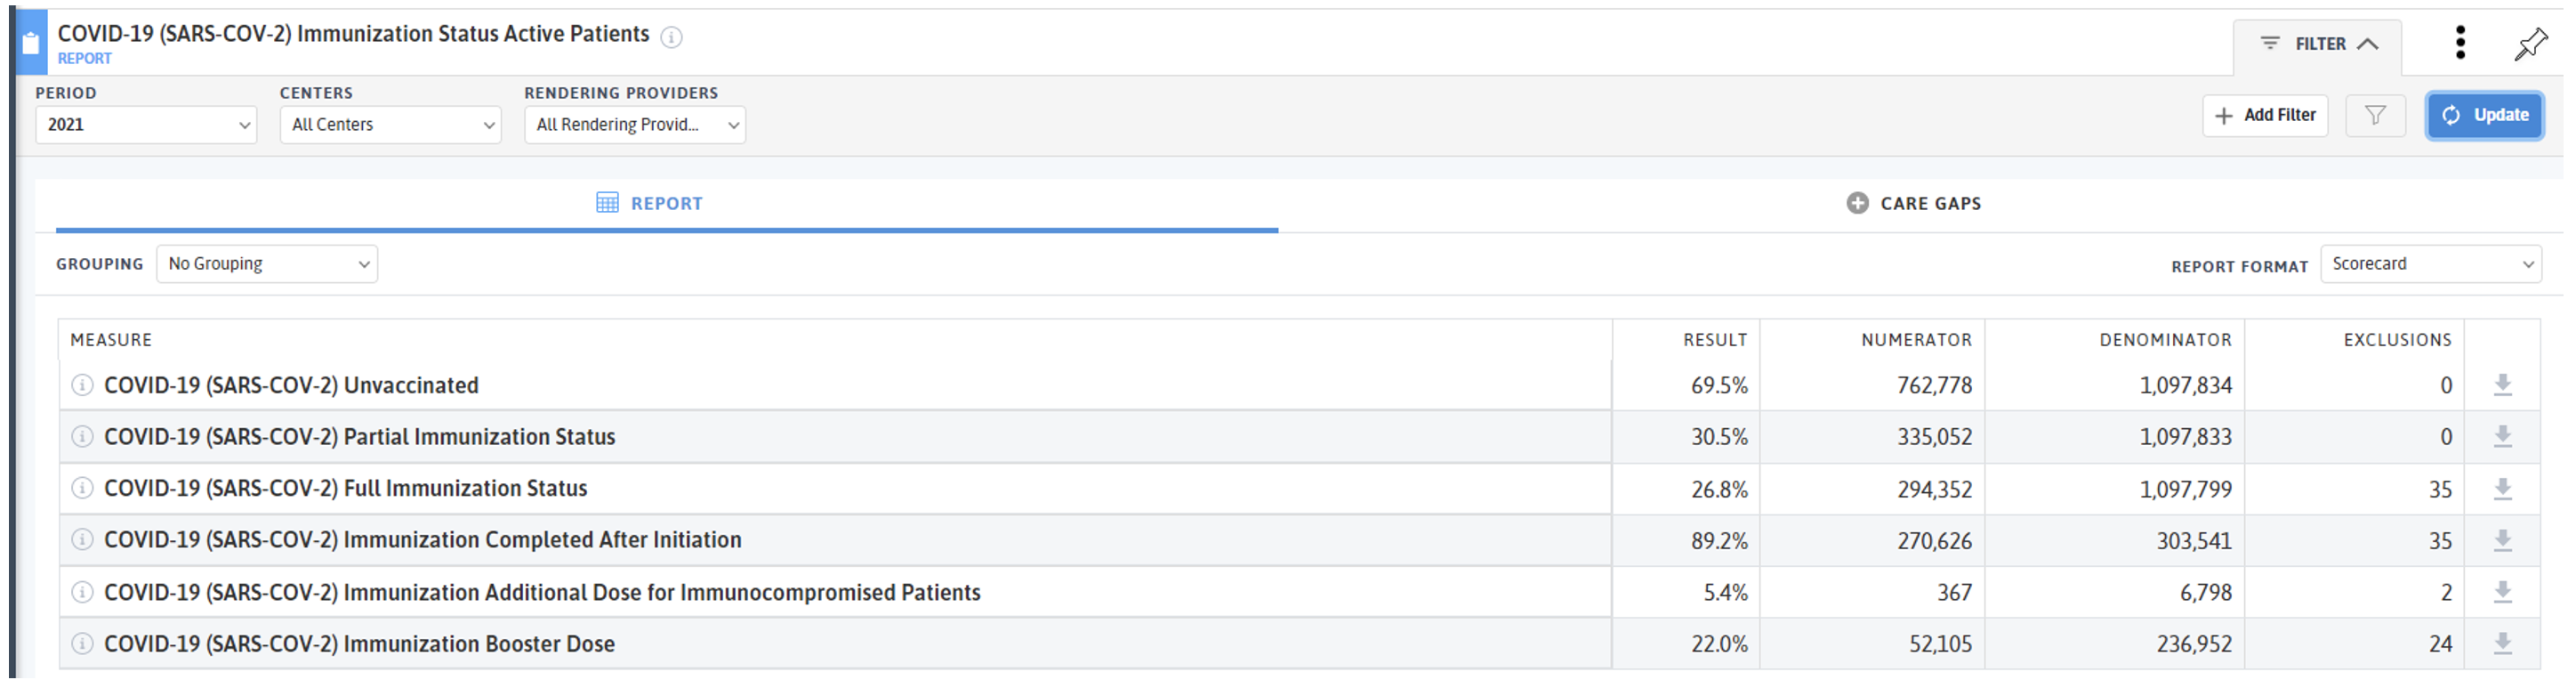
Here, we can see a breakdown of all the patients meeting the parameters of the question – “my practice’s patients.” If you read the info snippet of any of these measures, you can see they are counting patients, not vaccines, and are requiring a qualifying visit in the last 12 months:
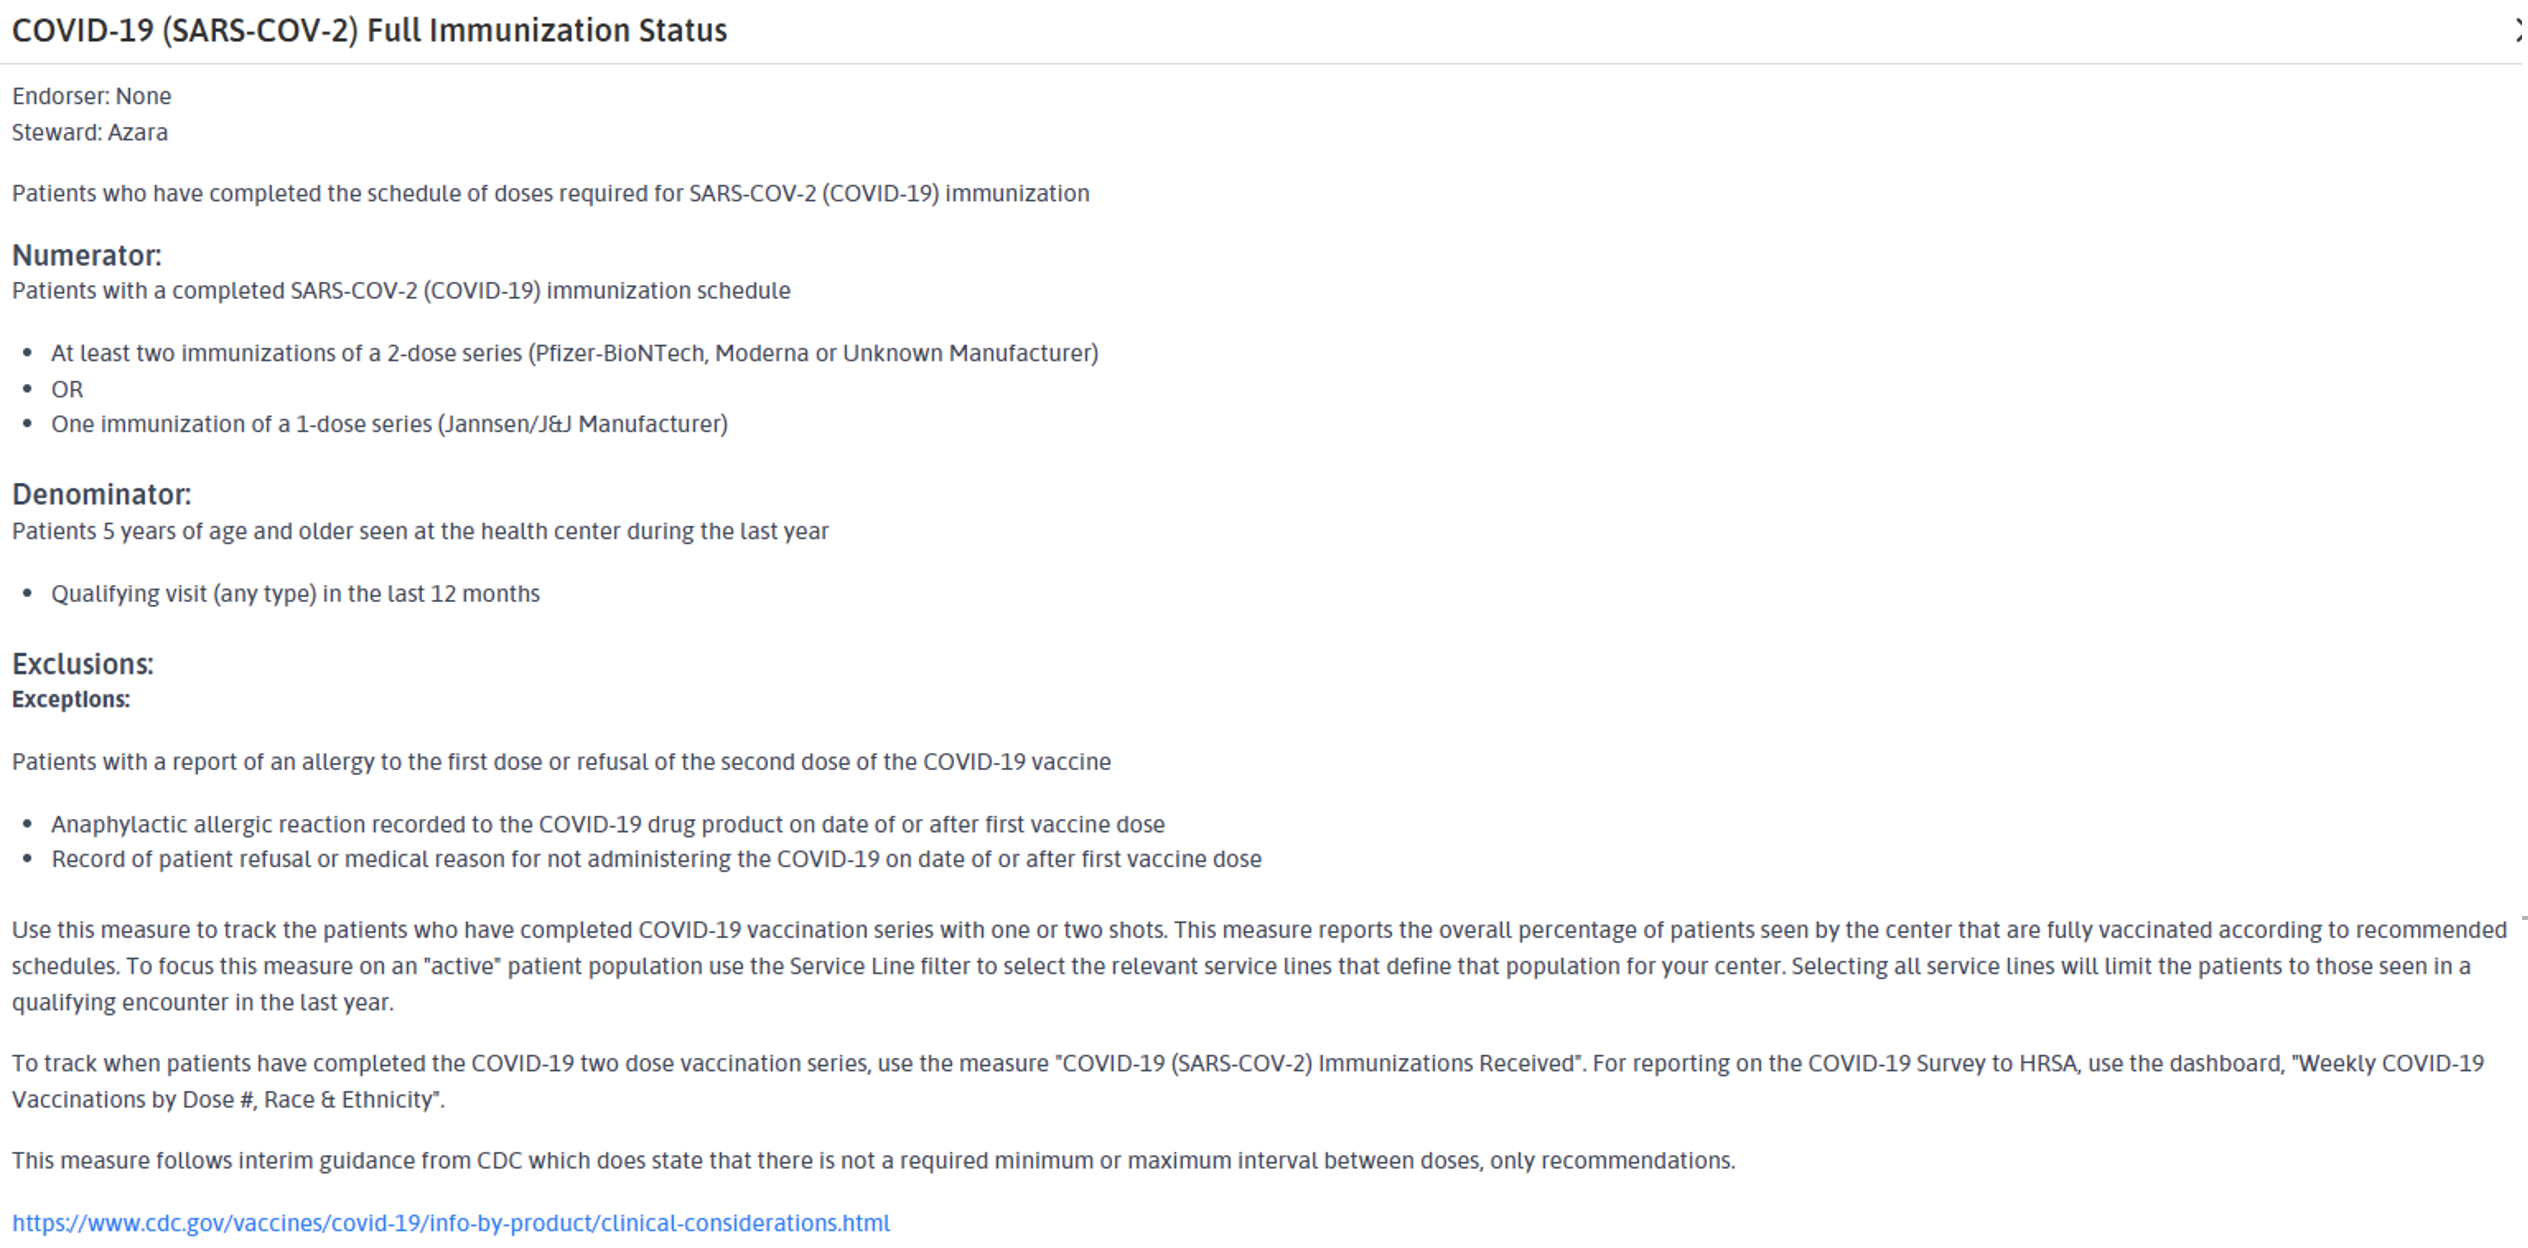 Based on that population of “my practice’s patients”, I can then see who is unvaccinated, who has initiated, and who is fully immunized. I can also see who has completed their series after initiation, who has received an additional dose, and who has received a booster. You may notice that the denominators are the same for the first three measures but are different for the second three. That is because these measures answer different questions. The Full Immunization Status measure tells me who among “my patients” is fully vaccinated, regardless of when and where the series was initiated; as long as it is in the EHR, it counts.
But the Immunization Completed After Initiation is showing me among the population who initiated a first dose, who went on to complete the series. The denominators are different. As we can see from the data in this screenshot, fully immunized patients make up a much smaller percentage than those who completed the series after initiation.
This is not surprising – patients who choose to initiate the series are more likely to complete it. The Completed After Initiation measure helps you know who needs a follow up vaccine through the gap list, while the Full Immunization Status gap could be patients who may still need a first dose.
This is just one example of how many ways there are to parse data around a seemingly simple question; imagine the complexity of defining this type of data need at a national level. Some key takeaways for DRVS users (and really anyone trying to make sense of any data):
- Read the definitions of measures/reports carefully. Do you understand who or what is being measured?
- Does what is being measured help you? In the above example, if your practice is trying to determine how many vaccine doses have been administered to assess future need or calculate reimbursement, the number of patients who have been vaccinated is not the right metric. You need to count doses, not patients, so find a different measure/report. In DRVS this would be the COVID-19 (SARS-COV-2) Immunization Doses Received.
- What context do I need to make sense of this data? This question can also be expressed as “what context is missing from the data I am being presented”? In the above example, if I were just told that 26.8% of my population was fully vaccinated with no other information, I should be asking a lot of questions about where that number came from and how it is defined.
Throughout this pandemic, most Americans have been exposed to data that they are wholly unprepared to interpret. This is not because Americans cannot understand complex data; it is because even experts cannot agree on how to define what to measure. Even if they can, the data is often lacking crucial context that would make it actionable.
I write this post not to discourage data review, but quite the opposite; the more time spend questioning and probing data, the greater its value for decision making. So as always, thank you to our wonderful clients who ask the right questions to make their data, and our product, ever better. And thank you to the amazing team at Azara who has been updating our COVID reporting suite non-stop for the past 2 years and will continue to do so as long as it takes.
For more information on Azara’s COVID tools, please see our COVID-19 Tools in DRVS page in the Help section.
Related Articles

From Release to Recovery: Closing Care Gaps for Justice-Involved Populations
Explore Insights
Turning Every Encounter into Value: How Azara's EHR Plug-In Elevates Risk Adjustment at the Point of Care
Explore Insights